Economic Indicators in Investment Analysis
Economic data releases provide the factual foundation for investment analysis. Understanding how to interpret key indicators — and crucially, how markets respond to data relative to consensus expectations — is an essential skill for evidence-based investment decision-making.
How Economic Indicators Drive Markets
Financial markets are forward-looking mechanisms — prices reflect not current conditions but expectations of future conditions. This has an important implication for how economic data affects markets: it is not the absolute level of an indicator that matters most, but whether it is better or worse than market consensus expectations. A strong GDP reading that exactly matches forecasts may cause little market reaction; a modestly positive figure that significantly exceeds pessimistic expectations can drive sharp rallies.
Axiom's macro analysis focuses on three layers of economic data interpretation:
- Absolute level: Is the economy growing, contracting, or at trend?
- Direction of change: Is the trend improving or deteriorating?
- Versus expectations: Did the data beat, meet, or miss consensus forecasts?
Data that consistently beats expectations — often measured by economic surprise indices like the Citi Economic Surprise Index (CESI) — tends to support equity markets, weaken government bonds, and strengthen the currency. Data disappointments produce the opposite pattern.
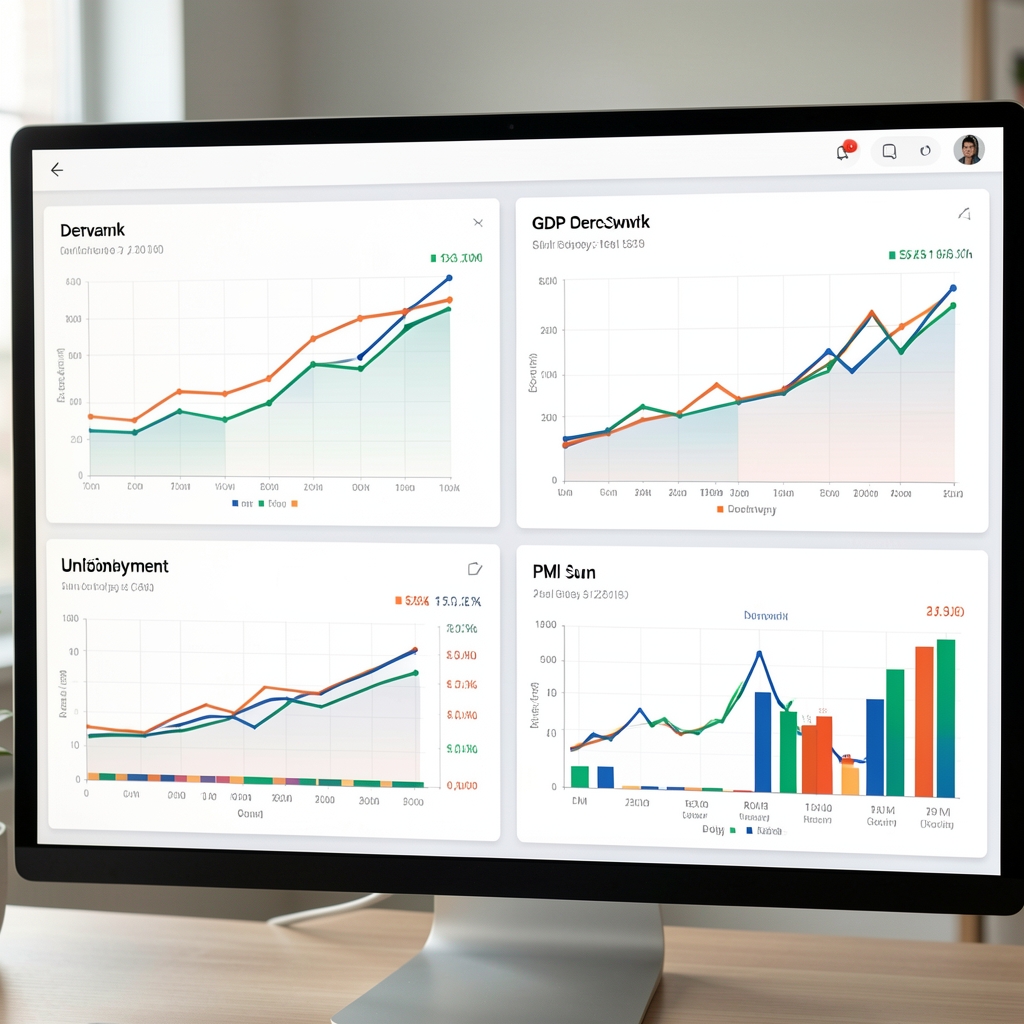
Leading, Coincident & Lagging Indicators
Leading Indicators
Change before the economy as a whole changes — useful for predicting future economic direction.
- PMI Manufacturing and Services (advance signal)
- Yield curve slope (term spread)
- Business and consumer confidence surveys
- Stock market performance
- Building permits and new housing starts
- Money supply growth (M2)
- Credit conditions surveys
Coincident Indicators
Change at the same time as the economy — confirm the current state of economic conditions.
- GDP (quarterly real growth rate)
- Industrial production index
- Retail sales volume
- Employment levels
- Personal income and consumption
Lagging Indicators
Change after the economy has begun a trend — confirm that a cycle is underway.
- Unemployment rate (peaks after recession)
- Consumer price inflation (CPI/HICP)
- Bank lending rates
- Corporate earnings (reported quarterly)
- Commercial real estate prices
Key Indicators: Danish & European Context
Detailed interpretation guidance for the most market-relevant economic indicators.
| Indicator | Source | Frequency | Market Impact | DK/EU Relevance |
|---|---|---|---|---|
| GDP Growth | Danmarks Statistik / Eurostat | Quarterly (first estimate) | High — sets macroeconomic narrative | DK GDP growth consistently near EU average at 1.5–2.5% trend |
| HICP Inflation | Eurostat / Danmarks Statistik | Monthly | Very High — central bank policy driver | ECB 2% target; DK peg means ECB policy is directly transmitted |
| PMI Manufacturing | S&P Global (flash) | Monthly | High — leading indicator for equities | Eurozone PMI highly relevant; >50 = expansion, <50 = contraction |
| PMI Services | S&P Global (flash) | Monthly | High — services-dominant economies | Denmark is service-heavy; services PMI particularly relevant for OMXC25 |
| Unemployment Rate | Danmarks Statistik | Monthly | Medium — lagging indicator | DK unemployment near structural lows (4.5–5.5%); wage growth key |
| ECB Interest Rate Decision | European Central Bank | Every 6 weeks | Very High — bond and equity pricing | Direct transmission via EUR/DKK peg; Nationalbank mirrors ECB rates |
| Fed Funds Rate (FOMC) | Federal Reserve | Every 6-8 weeks | Very High — global risk sentiment | Affects USD/DKK rate, global equity valuations, capital flows |
| ZEW Economic Sentiment | ZEW Mannheim | Monthly | Medium-High — Germany/EU leading | German economic sentiment is a proxy for broader European outlook |
| Ifo Business Climate | Ifo Institute | Monthly | Medium-High | Germany is DK's largest trade partner; Ifo serves as a real-time signal |
| Consumer Confidence (DK) | Danmarks Statistik | Monthly | Medium — consumption outlook | Danish household consumption is approximately 48% of GDP |
The Business Cycle & Asset Class Performance
Economic data interpretation is most useful when placed within the context of the business cycle phase. Different asset classes tend to perform best in different phases of the cycle — a framework known as "cycle rotation" or "regime-based allocation."
Expansion
GDP growth above trend; PMI >55; employment rising; corporate earnings growing; inflation low-to-moderate
Late Cycle / Peak
Growth still positive but decelerating; inflation rising; central bank tightening; yield curve flattening
Contraction / Recession
Negative GDP growth; PMI <50; rising unemployment; earnings declining; central bank easing
Recovery
Growth returning to positive; PMI recovering from lows; unemployment stabilising; inflation subdued
Macro Analysis in Every Axiom Report
Our research reports contextualise individual security and sector analysis within the current macroeconomic cycle, providing a structured economic framework for investment decisions.