Investment Risk Management
Understanding, measuring, and managing investment risk is as important as seeking return. Effective risk management is not about eliminating risk — it is about ensuring the risks taken are intentional, understood, and appropriately compensated.
Risk in Investment Practice
In everyday language, "risk" often means the chance of a bad outcome. In investment analysis, risk has a more precise meaning: it refers to the uncertainty of future returns, including both unexpected gains and unexpected losses. This distinction matters because investment frameworks must address both the upside and downside dimensions of uncertainty.
The relationship between risk and return is fundamental to finance. Higher expected returns generally require accepting higher levels of risk. The critical question is not whether to take risk, but whether the risks in a portfolio are:
- Intentional: Consciously chosen based on investment objectives
- Understood: Properly identified, measured, and monitored
- Compensated: Expected to generate adequate return relative to the risk accepted
- Controlled: Managed within pre-defined limits consistent with investment policy
Axiom's risk management research helps investors build analytical frameworks to evaluate these dimensions systematically across their portfolio holdings.
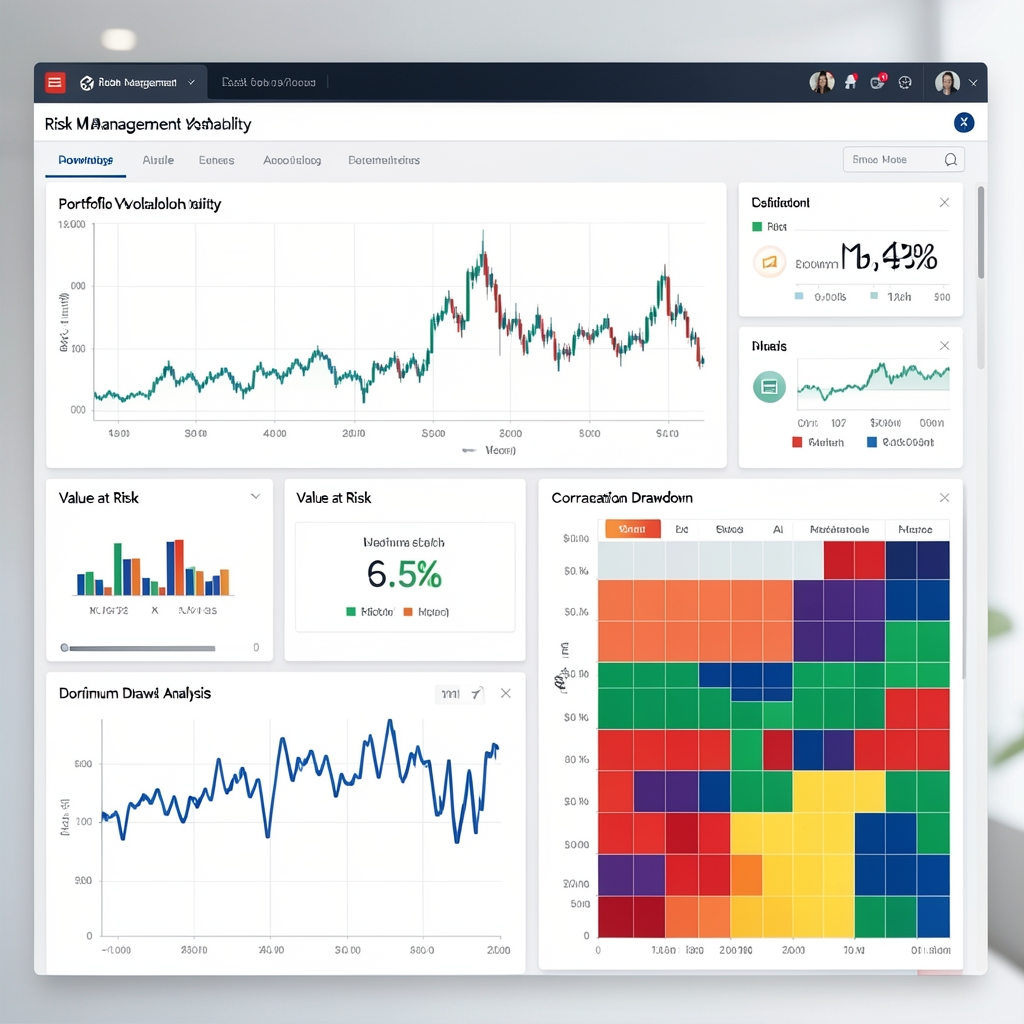
Taxonomy of Investment Risks
Market Risk
SystematicThe risk of losses due to factors affecting the entire market or asset class: interest rate changes, equity market declines, commodity price swings, and currency movements. Market risk cannot be diversified away within an asset class — it is the "beta" exposure inherent in market participation.
Credit Risk
Specific + SystematicThe risk that a bond issuer or counterparty fails to meet its contractual obligations — either delaying payments (default) or having those obligations reduced through restructuring. Credit risk encompasses default risk, credit spread risk (change in market perception of creditworthiness), and counterparty risk in derivatives.
Liquidity Risk
Asset + FundingAsset liquidity risk is the risk of being unable to sell an investment quickly at close to fair value. Funding liquidity risk is the risk that an investor cannot meet cash obligations without selling assets at distressed prices. Illiquid investments (private equity, real estate) command an illiquidity premium — additional return to compensate for reduced flexibility.
Operational Risk
Process & SystemThe risk of loss from inadequate or failed internal processes, systems, human errors, or external events. In an investment context, this includes trade settlement failures, custody risks, data errors in analytical models, and technology failures. Operational risk is often overlooked in portfolio construction but can cause severe losses.
Concentration Risk
IdiosyncraticExcessive exposure to a single security, sector, geography, or risk factor. Danish investors with heavy OMXC25 exposure — particularly Novo Nordisk, which represents over 40% of the index — face significant concentration risk that can only be addressed through deliberate international diversification.
Inflation Risk
MacroThe risk that investment returns fail to keep pace with inflation, eroding real purchasing power. Particularly relevant for fixed-income-heavy portfolios and cash holdings. Danish investors must consider Statistics Denmark's CPI and HICP measures when evaluating whether portfolio returns preserve real wealth.
Risk Measurement Tools
Standard Deviation (Volatility)
The most widely used risk metric — measuring the degree of dispersion around the average return. Annualised standard deviation (volatility) allows comparison across different investment periods. A portfolio with 15% annual volatility has roughly a two-thirds probability of returning within ±15% of its expected return in any given year (assuming normal distribution — a simplifying assumption).
Value at Risk (VaR)
VaR estimates the maximum expected loss over a given time period at a specified confidence level. For example, a 1-day 95% VaR of DKK 50,000 on a DKK 1,000,000 portfolio means there is a 95% probability that the portfolio will not lose more than DKK 50,000 in a single trading day. VaR has significant limitations — it says nothing about the magnitude of losses beyond the confidence threshold.
Maximum Drawdown
The largest peak-to-trough decline in portfolio value over a given period. Maximum drawdown is a direct measure of the worst-case loss scenario experienced historically and is directly relevant to investor psychology and the risk of forced selling at market lows. The S&P 500 experienced a maximum drawdown of approximately -56% during the 2007-2009 financial crisis.
Sharpe Ratio
The Sharpe Ratio measures excess return per unit of total risk: (Portfolio Return - Risk-Free Rate) / Standard Deviation. A higher Sharpe Ratio indicates better risk-adjusted performance. Danish investors should use the Danish 3-month government bond yield as the appropriate risk-free rate. A Sharpe Ratio above 1.0 is generally considered good in professional practice.
Beta
Beta measures the sensitivity of an asset or portfolio's returns to market movements. A beta of 1.0 means the investment moves in line with the market. Beta above 1.0 indicates amplified market exposure (higher risk/return potential); below 1.0 indicates lower market sensitivity. Beta is calculated relative to a benchmark — for Danish equities, typically the OMXC25 or MSCI Europe.
Tracking Error
For portfolios measured against a benchmark, tracking error (the standard deviation of excess returns relative to the benchmark) quantifies how much the portfolio deviates from benchmark performance. Index fund managers target minimal tracking error; active managers accept tracking error in exchange for the potential of alpha generation.
Conditional Value at Risk (CVaR)
Also known as Expected Shortfall (ES), CVaR addresses the primary limitation of VaR by measuring the average expected loss in the worst-case scenarios beyond the VaR threshold. CVaR is increasingly preferred by risk professionals and is embedded in EU regulatory frameworks (FRTB for banks) as a superior tail risk measure.
Stress Testing & Scenario Analysis
Historical stress tests apply known crisis scenarios (2008 financial crisis, 2020 COVID shock, 2022 rate spike) to current portfolio positions to estimate hypothetical losses. Scenario analysis uses hypothetical "what-if" frameworks. Both approaches complement statistical risk measures by capturing non-linear, tail-event dynamics.
Risk Control Mechanisms
Position Sizing
Limiting the portfolio weight of any single holding controls idiosyncratic concentration risk. Common guidelines suggest no single equity position should exceed 5-10% of a portfolio. Sector exposures are often capped at 25-30% of equity allocation.
Rebalancing
Systematic rebalancing back to target weights prevents drift from creating unintended risk concentrations. Annual or threshold-based rebalancing (rebalance when weight deviates by more than 5%) are common approaches, balancing risk control against transaction costs.
Asset Allocation Constraints
Investment policy statements often define minimum and maximum allocations for each asset class. These constraints enforce diversification discipline and prevent overreaction to short-term market developments.
Duration Management
For fixed income portfolios, controlling portfolio duration limits interest rate sensitivity. Shortening duration before expected rate rises and extending during easing cycles is a core tactical risk management tool.
Currency Hedging
International investments introduce FX risk. Currency forwards or FX-hedged fund share classes can neutralise this risk, though hedging carries costs. The decision whether to hedge depends on investment horizon, currency volatility, and hedging cost.
Stop-Loss Disciplines
Pre-defined stop-loss levels — triggering a review or automatic reduction of a position if it falls by a specified percentage — are a common risk control in active management. Stop-losses impose discipline and prevent small losses from becoming large ones through emotional inaction.
Risk-Aware Research for Informed Investors
All Axiom research reports include explicit risk assessment sections, covering key risks to our analytical views and quantitative risk metrics for discussed instruments.