Investment Fundamentals
Sound investment decisions are built on clear conceptual foundations. This educational section covers the core principles that underpin professional investment practice — from defining an asset class to understanding how compounding generates long-term wealth.
Why Investment Education Matters
The financial research industry produces enormous volumes of analysis, data, and opinion. Without a conceptual framework to evaluate this information, investors — whether private individuals or professionals — risk making decisions based on surface-level narratives rather than sound financial reasoning.
Axiom's educational content is designed to support the analytical literacy needed to engage critically with financial research, including our own. We believe that well-informed readers are better able to contextualise research findings, assess methodological quality, and apply analytical insights to their own investment situations.
This section provides a structured introduction to investment concepts organised by topic. Each module builds on the previous, moving from fundamental definitions to practical application frameworks.
Asset Classes & Their Characteristics
An asset class is a grouping of investments that share similar financial characteristics, behave similarly in the marketplace, and are subject to the same laws and regulations. The traditional major asset classes are equities, fixed income (bonds), cash equivalents, and real assets (property, commodities). Alternative investments — hedge funds, private equity, infrastructure — form a fourth category often relevant to institutional investors.
Equities (Shares)
Ownership StakesEquities represent ownership interests in companies. Shareholders participate in company profits through dividends and benefit from capital appreciation if the company's value increases. Equities have historically delivered the highest long-run returns of major asset classes but with significant short-term volatility.
Fixed Income (Bonds)
Debt InstrumentsBonds are debt instruments where the issuer (government or corporation) borrows capital from investors, promising regular interest payments (coupons) and principal repayment at maturity. Bonds typically offer lower returns than equities but provide income stability and capital preservation characteristics.
Cash & Cash Equivalents
Monetary AssetsBank deposits, money market funds, and short-term treasury bills. Cash provides capital security and maximum liquidity but historically earns returns that lag inflation over long periods, resulting in negative real returns in many environments.
Real Assets
Physical AssetsProperty, commodities, infrastructure, and timberland. Real assets provide inflation hedging characteristics because their intrinsic value is tied to physical goods and services. They often have low correlation with financial assets, offering diversification benefits. Danish realkreditobligationer (mortgage bonds) blend fixed income and real asset characteristics.
Understanding Investment Returns
Accurately measuring investment returns is fundamental to performance evaluation and comparison. Several return metrics are used in professional practice, each with specific applications and limitations.
Total Return
Total return captures both income (dividends, coupons) and capital appreciation/depreciation. For a period t:
Where P₁ = ending price, P₀ = beginning price, D = distributions received
Time-Weighted Return (TWR)
TWR eliminates the distorting effect of external cash flows, making it the standard for evaluating fund manager performance. It calculates the geometric mean of sub-period returns between cash flows.
Compound Annual Growth Rate (CAGR)
CAGR expresses multi-year returns as a single smoothed annual rate, enabling comparison across different investment periods:
Where n = number of years
Real vs Nominal Returns
Nominal returns do not adjust for inflation. Real returns — the actual increase in purchasing power — are calculated using the Fisher equation: Real Return ≈ Nominal Return - Inflation Rate. Long-term investment analysis should always focus on real returns to assess true wealth creation.
The Power of Compounding
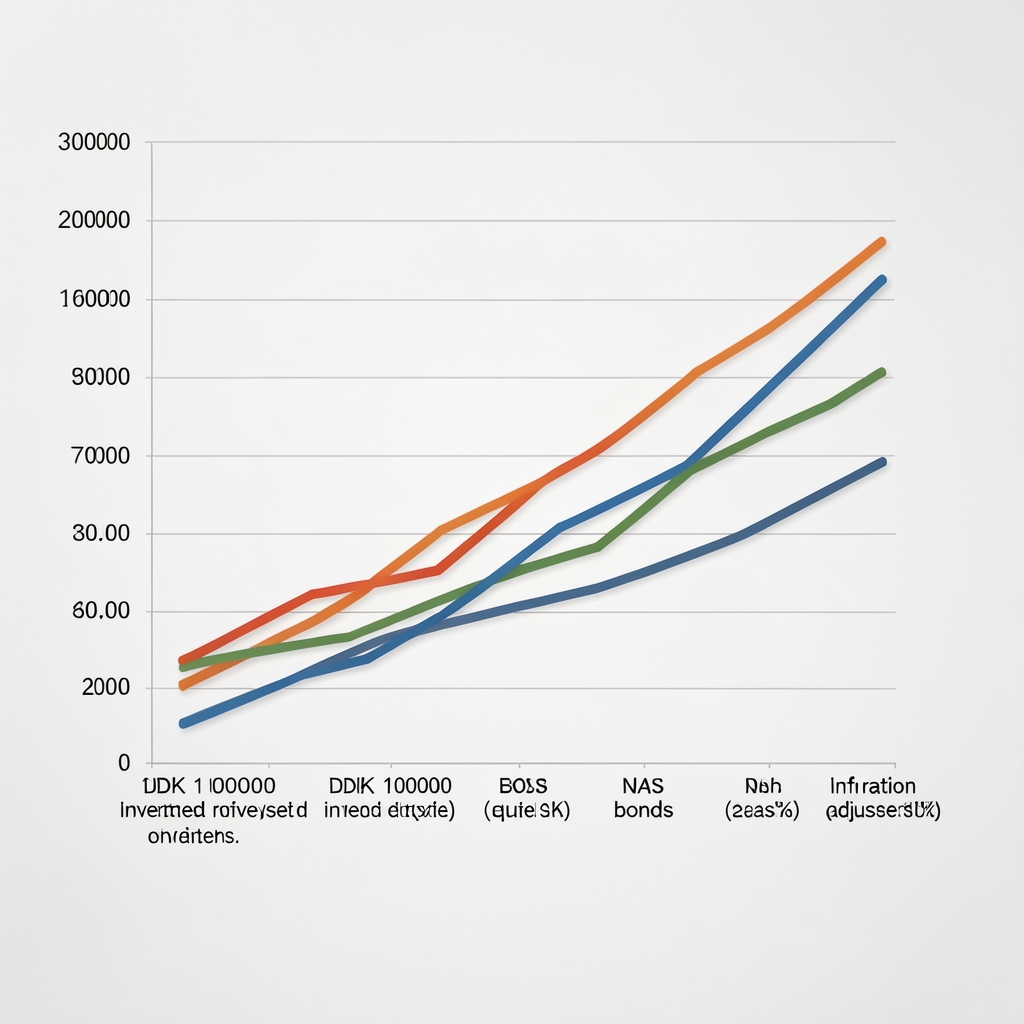
Compounding — earning returns on previously earned returns — is the fundamental mechanism by which patient, long-term investors build substantial wealth. Albert Einstein reportedly described compound interest as "the eighth wonder of the world," though the mathematical power of compounding requires no endorsement beyond the numbers themselves.
Illustrative Growth of DKK 100,000 at Various Return Rates
| Years | 3% p.a. | 5% p.a. | 7% p.a. | 10% p.a. |
|---|---|---|---|---|
| 5 years | DKK 115,927 | DKK 127,628 | DKK 140,255 | DKK 161,051 |
| 10 years | DKK 134,392 | DKK 162,889 | DKK 196,715 | DKK 259,374 |
| 20 years | DKK 180,611 | DKK 265,330 | DKK 386,968 | DKK 672,750 |
| 30 years | DKK 242,726 | DKK 432,194 | DKK 761,226 | DKK 1,744,940 |
Illustrative only. Does not account for taxes, inflation, or investment costs. Past rates are not indicative of future returns.
Diversification Principles
Diversification is the practice of allocating investments across assets that do not perfectly correlate with each other, so that gains in some positions offset losses in others. Harry Markowitz formalised this concept in his 1952 paper "Portfolio Selection," which formed the foundation of Modern Portfolio Theory.
The key insight of diversification is that the risk of a portfolio is not simply the weighted average of individual asset risks — it is reduced by the diversification benefit when assets are less than perfectly correlated. A portfolio's total risk can be decomposed into:
- Systematic (market) risk: Risk that affects all assets and cannot be diversified away — macroeconomic shocks, interest rate changes, geopolitical events.
- Idiosyncratic (specific) risk: Risk unique to a specific company, sector, or geography. This risk can be substantially reduced through diversification.
Research suggests that 20-30 uncorrelated holdings can eliminate most idiosyncratic risk from an equity portfolio. However, true diversification requires not just a large number of holdings, but holdings that represent genuinely different risk exposures — across geographies, sectors, asset classes, and economic factor sensitivities.
Correlation: The Key to Diversification
Correlation coefficients range from -1 (perfect negative correlation) to +1 (perfect positive correlation). The lower the correlation between two assets, the greater the diversification benefit when they are combined in a portfolio.
Correlations are not static — they tend to increase significantly during market crises, precisely when diversification is most needed. This is a well-documented limitation of traditional correlation-based portfolio construction.
Further Topics: Process, Horizons & Market Efficiency
Module 5: The Investment Process
A structured investment process begins with an Investment Policy Statement (IPS) defining objectives, constraints, and risk tolerance. It proceeds through strategic asset allocation (long-term target weights), tactical asset allocation (shorter-term adjustments), security selection, and ongoing performance attribution and review.
Explore Portfolio Theory →Module 6: Investment Time Horizons
Investment horizon profoundly affects appropriate asset allocation. Investors with long horizons (10+ years) can accept higher short-term volatility in exchange for the higher expected long-run returns of equities. Investors with near-term liquidity needs require lower-risk, more stable instruments. Danish pension savers transitioning from accumulation to decumulation phases face this rebalancing challenge explicitly.
Explore Risk Management →Module 7: Market Efficiency
The Efficient Market Hypothesis (EMH) proposes that asset prices reflect all available information. The weak, semi-strong, and strong forms of the EMH have different implications for whether technical analysis, fundamental analysis, or insider information can generate excess returns. In practice, markets exhibit varying degrees of efficiency across asset classes, geographies, and time periods.
Explore Equity Analysis →Apply These Concepts with Axiom Research
Our analytical reports are designed to be accessible to investors with a solid conceptual foundation. Subscribe to receive research that bridges investment theory and real-world market analysis.